
Program
The carbon sink of the Coral Sea weakened during 2006-2018 according to the sea-air CO2 flux remote sensing dataset
Date:2023-03-09
Hits:3697
Recently, the team headed by researcher Bai Yan of the SIO and the co-authors published the research paper entitled “The carbon sink of the Coral Sea, the world’s second largest marginal sea, weakened during 2006-2018” in the environmental science and ecology TOP journal Science of The Total Environment (IF=10.75). The first author of the paper is Zhang Siqi, a doctoral student jointly trained by the SIO and the University of Chinese Academy of Sciences, the corresponding author is researcher Bai Yan of the SIO, and the co-authors include researcher He Xianqiang, senior engineer Gong Fang, professor level senior engineer Zhu Qiankun, academician Pan Delu from the SIO.
The GCP 2022 report shows that the ocean absorbs approximately 26 % of anthropogenic CO2 and that the carbon sink of the global ocean is continually increasing under constant atmospheric CO2 concentration increase, while variations in different marginal seas are complicated. The use of remote sensing to understand the patterns and changes of carbon sink in different marginal sea systems will help us to deeply understand the changes in ocean carbon sequestration capacity under the multiple pressures of global climate change and human activities.
The Coral Sea, the second largest marginal sea in the world, is characterized by a generally oligotrophic basin and borders the biodiversity hotspot of Great Barrier Reef, with complex biogeochemical processes in seawater; Due to the uneven spatial and temporal distribution of observed samples, there is no sufficient research on the changes of sea-gas CO2 flux and seawater carbon sink capacity in the Coral Sea. On the basis of MeSAA (Mechanistic-based Semi-Analytic-Algorithm) constructed by the team in the previous stage (Bai*, et al., 2015), in this study, the quantification of the impact of atmospheric CO2 concentration growth was increased according to the regional ocean characteristics of the Coral Sea, and the high-resolution satellite-based pCO2 and air-sea CO2 flux dataset from 2006 to 2018 for the Coral Sea was reconstructed (Figure 1). This dataset performed well in the basin (RMSE<10 μatm, R2 > 0.72) and coral reef areas (RMSE<12 μatm, R2 > 0.8), and can well restore the long time series changes of seawater pCO2 in the Coral Sea based on validation by a massive independent dataset (Figure 2).

Figure 1 Spatial distribution map of monthly mean seawater pCO2 of Coral Sea climate state from 2006 to 2018
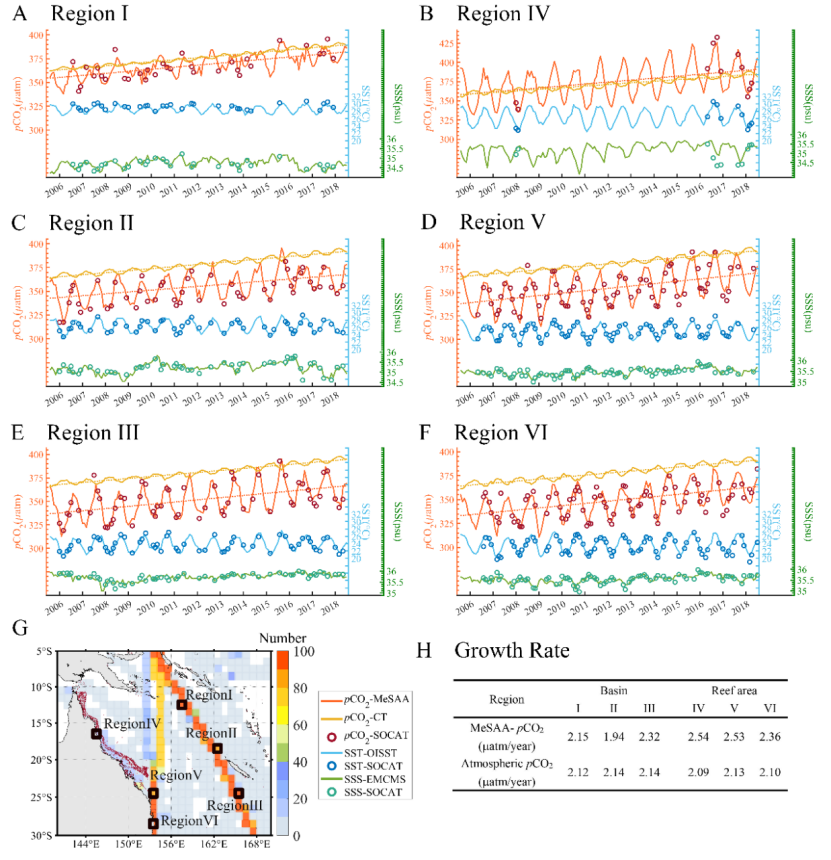
Figure 2 (A-F) Time series plot of monthly changes in pCO2, temperature and salinity in six 1º×1 º regions during 2006-2018. The hollow circle represents the measured monthly average data from the SOCAT dataset, and the solid line is the model or satellite remote sensing monthly average data under the same spatiotemporal matching. (G) Schematic diagram of the location of six regions. (H) The annual average symptom rate (P value < 0.001) of MeSAA-pCO2 retrieved by satellite in the region and atmospheric pCO2 from CarbonTracker.
We found that sea surface pCO2 is increasing (1.8 to 2.7 μatm/year) under the forcing of increasing atmospheric CO2, and the pCO2 growth rate in water is faster than that in the atmosphere. Due to the transport of high pCO2 seawater along the coast from coral reef areas and the retention of water mass, the growth rate of pCO2 in offshore seawater was faster (>2.5 μatm/ year). From 2006 to 2018, the Coral Sea as a whole was a carbon sink, but the amount of atmospheric CO2 absorbed by seawater showed a decreasing trend (the sea-air CO2 flux in 2016 was only 52% of that in 2006). The combination of increasing sea surface pCO2, high pCO2 seawater from coral reef areas, and the low depletion capacity of the oligotrophic basin led to a gradual weakening of the carbon sink in the Coral Sea. This weakening was more pronounced after strong El Niño events (e.g., 2007, 2010, and 2016), with the corresponding high SST and low wind speed further reducing the sea-air CO2 flux and weakening the carbon sink.
Different from other traditional pCO2 regional algorithms based on large data volume matching of environmental parameters and target parameters (such as multiple regression method or machine learning algorithm), the MeSAA algorithm built for the Coral Sea used only 14.2% of the data for algorithm construction (regional data dominated by single factor and with less interference from other mechanisms), and the remaining 85.8% of completely independent data was used for validation. The MeSAA-pCO2 algorithm not only provides more independent data for validation, but also helps analyze and understand the impact of different processes on pCO2 changes, as its modeling process quantifies the control mechanism of seawater pCO2. The annual variance was characterized with the difference between February and August, and it was found that the pCO2 influenced by temperature thermodynamics was about 5-45 µatm, while the biological effect was about 5-20 µatm. In terms of trend change, the difference between mean seawater pCO2 in the first five years (2006-2010) and the last five years (2014-2018) of the study period was used to quantify the relative contribution of thermodynamics, biology and other factors (mainly the impact of atmospheric CO2 rise) to the interannual change. It was found that the contribution ratio of atmospheric forcing, thermodynamic action and biological action to seawater pCO2 in Coral Sea from 2006 to 2018 is about 27:3:1 (Figure 3). Although temperature controls the seasonal variation of pCO2 at the sea surface, the annual increase of atmospheric CO2 is one of the key reasons for the rise of pCO2 in the Coral Sea from 2006 to 2018. This understanding of the long-term change in the Coral Sea provides new insight on the carbonate system variation and carbon sink capacity evolution in seawater.
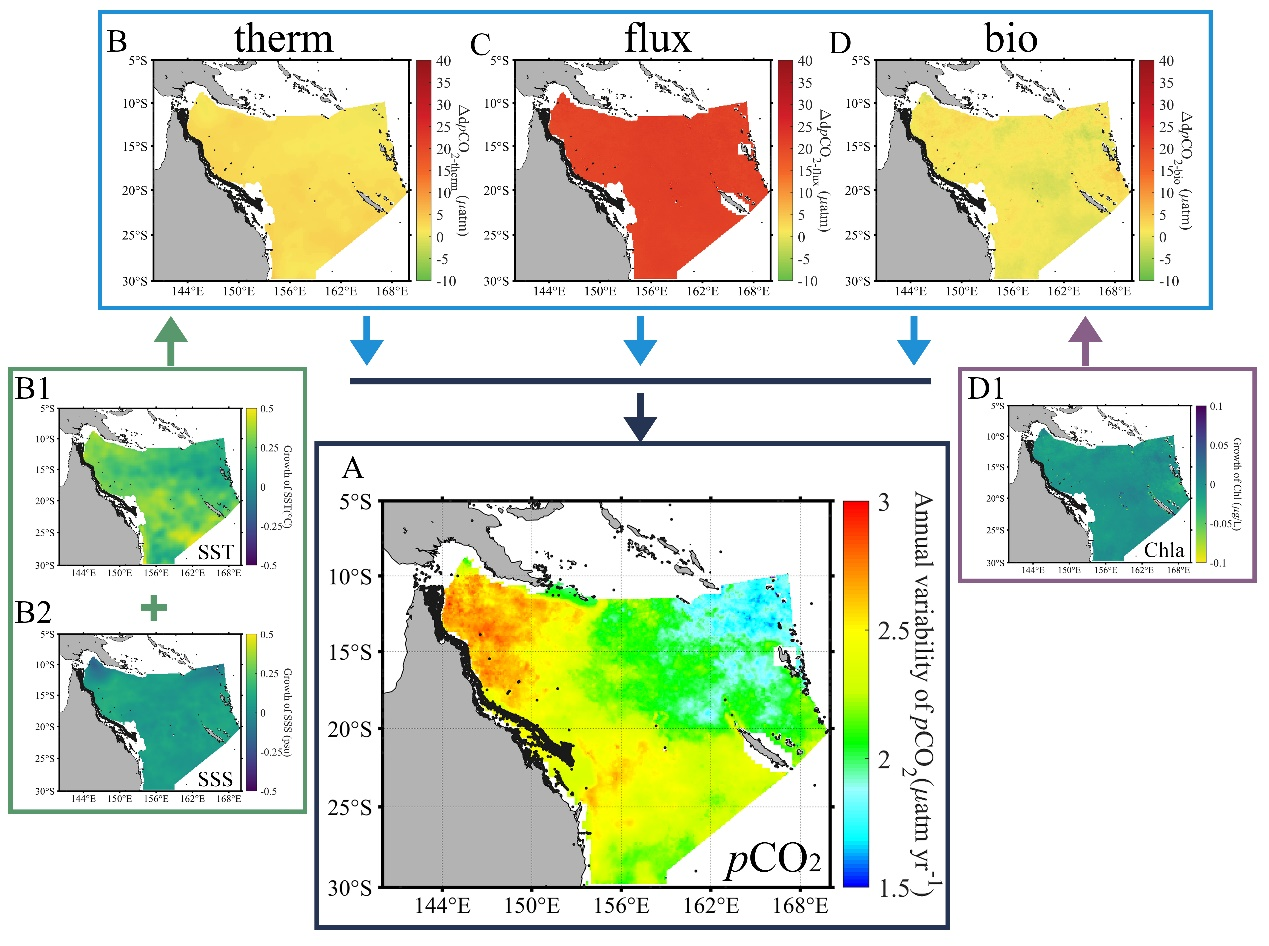
Figure 3 (A) Spatial distribution map of pCO2 growth rate from 2006 to 2018 (unit: μatm/year), and the changes in seawater pCO2 between P06-10 (2006-2010 climate state seawater pCO2) and P14-18 (2014-2018 climate state seawater pCO2) caused by thermodynamic action (B), atmospheric forcing (C) and biological effect (D). Increase in temperature (B1), salinity (B2) and Chla (D1) in the Coral Sea from 2006 to 2010 and 2014 to 2018. *Note: P values are all less than 0.001 in the calculation of growth rate.
Paper Citation:
Zhang, S., Bai, Y.*, He, X., Yu, S., Song, Z., Gong, F., Zhu, Q., & Pan, D.(2023). The carbon sink of the Coral Sea, the world's second largest marginal sea, weakened during 2006–2018 Science of The Total Environment, 872.

